Music Visualizer
Languages/frameworks used: C#.NET, NAudio, ffmpeg
I designed this program in order to automatically create videos that move in time with music. I wanted to upload the music I create to YouTube, but using a simple still picture throughout the video would have been boring.
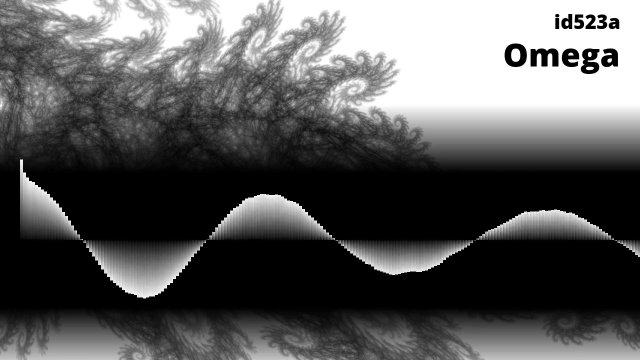
For each frame of output, the program reads a segment of the audio file corresponding to that frame, and then calculates the autocorrelation of that segment, meaning the correlation between the signal and a time-delayed version of itself. The 'graph' shown in the frame is a plot of the autocorrelation as a function of time-delay. The first bar is at zero time delay, and the time-delay increases from left to right.
After analyzing each segment of sound, the frame is drawn using C#'s built-in 2D graphics libraries. The completed frames are sent to ffmpeg through a pipe (inter-process communication). In earlier versions of the program, each frame was saved to a file, and ffmpeg was then instructed to read the file.
Why autocorrelation?
Autocorrelation is a way to analyze signals to find repeating patterns. Repeating patterns of peaks and troughs in sound waves are heard as pitch, so the autocorrelation of a sound wave can indicate its pitch.
The highest peak in an autocorrelation plot is always at zero time delay: The signal matches up well with itself. The next peak in the autocorrelation is where the time delay is equal to one period of the sound wave. The high correlation indicates that the signal matches up well with itself shifted by one period, i.e. each wave peak correlates with the next wave-peak.